For a smaller farm, the key to AgTech viability isn’t buying expensive new machinery; it’s proving returns quickly by focusing on targeted retrofits and free data sources first.
- GPS auto-steering retrofit kits offer the fastest payback by cutting overlaps and reducing operator fatigue, often paying for themselves in 2-4 seasons.
- Variable rate application doesn’t require a costly subscription; it can be started using free Sentinel-2 satellite data and open-source software like QGIS.
Recommendation: Before committing to any significant capital expenditure, adopt a “retrofit-first” mindset. Use free tools to identify a single, high-variability field and test one technology to prove its value on your own land.
The glossy brochures and conference speakers all proclaim the same message: precision agriculture is the only way forward. They showcase massive, automated tractors gliding across thousand-acre fields, guided by satellites and armed with an arsenal of sensors. For the owner of an arable farm under 300 acres, this vision can feel more alienating than inspiring. The central question isn’t whether the technology works, but whether it pays. When your margins are tight and capital is precious, a ten-year payback period on a new machine isn’t an investment; it’s a gamble you can’t afford to lose.
The common advice to “invest in the latest tech” or that “data is the new gold” often ignores the practical realities of a smaller operation. The fear of being left behind is real, but so is the risk of being burdened by debt for technology that’s overkill for your scale. This isn’t about chasing every innovation. It’s about surgically applying specific, proven technologies that solve your most pressing problems without requiring a complete fleet overhaul. The marketing hype suggests you need an all-in-one ‘solution’, but what if the smarter path is more granular and grounded?
This guide cuts through the noise. We will not be exploring every futuristic gadget. Instead, we’ll adopt a skeptical, “prove-it-fast” approach focused on tangible returns. The core principle is simple: start with the lowest-hanging fruit, leverage free data sources to their fullest potential, and prioritize intelligent retrofits over expensive new iron. We will break down exactly which investments have the fastest and most verifiable ROI, how to get started with precision techniques for free, and how to avoid the costly compatibility mistakes that can derail the entire process. This is a blueprint for making AgTech work on your terms, and on your budget.
This article provides a clear, unbiased breakdown of where to invest for maximum impact. Below, the summary outlines the key areas we will cover to build a viable AgTech strategy for a smaller farm.
Summary: A Practical AgTech Investment Strategy for Smaller Farms
- Why GPS Steering Has the Fastest ROI of Any AgTech Investment?
- How to Start Variable Rate Seeding Using Free Satellite Data?
- Retrofit Kit vs New Tractor: Which Is the Smarter Tech Upgrade?
- The ISOBUS Compatibility Mistake That Leaves Kit Unable to Talk
- How to Use Yield Maps to Identify Loss-Making Areas of Your Farm?
- How to Reduce Fixed Machinery Costs by 20% Through Cooperative Agroecology?
- How to Build a Nitrogen Plan Using Free Satellite Data in 3 Steps?
- Variable Rate Nitrogen: Is the £15/ha Tech Subscription Worth It?
Why GPS Steering Has the Fastest ROI of Any AgTech Investment?
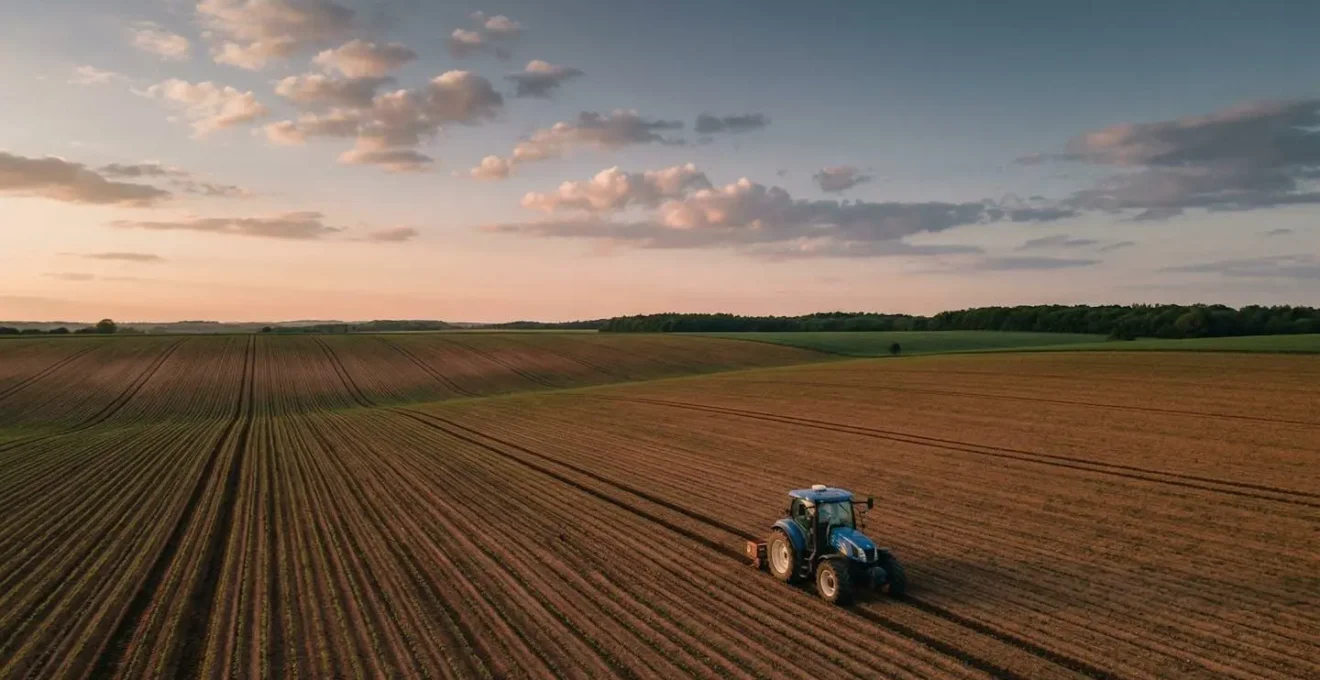
Before diving into complex variable rate maps or drone imagery, the most straightforward and fastest financial win in AgTech comes from simply driving straighter. For any arable farm, overlap on tillage, seeding, spraying, and spreading is a direct and quantifiable cost. GPS auto-steering systems, particularly retrofit kits, attack this waste head-on. While the initial outlay might seem significant, the payback period is often surprisingly short, with many farms seeing a return on investment within 2 to 4 years. The savings aren’t just theoretical; they show up immediately on your bottom line through reduced fuel, seed, and chemical consumption.
The benefits extend far beyond simple input savings. One of the most underrated advantages is the drastic reduction in operator fatigue. Long days during peak season lead to mistakes, inconsistent application, and stress. An auto-steer system allows the operator to focus on the implement’s performance rather than on keeping the tractor on a perfect line. This enables longer, more efficient operating windows, allowing you to get work done during tight weather windows, even into the night. It also lowers the skill barrier for new or temporary operators, ensuring precision work regardless of who is in the cab.
Case Study: The Retrofit Advantage
Analysis of GPS retrofit systems like FieldBee demonstrates how smaller farms can achieve high-precision results without massive capital investment. By using a modular architecture that often runs on a standard tablet, these systems provide 2.5cm accuracy. For farmers implementing this technology, the result is a tangible 10-15% reduction in input and labor costs, proving that upgrading existing equipment is a viable path to precision guidance.
Ultimately, GPS steering is the bedrock of precision farming. It creates the repeatable, reliable guidance paths that all other variable rate technologies depend on. Without it, you are attempting to apply precise data with an imprecise tool. It’s the foundational investment that makes every subsequent AgTech step more effective and profitable.
How to Start Variable Rate Seeding Using Free Satellite Data?
The term “variable rate” often conjures images of expensive software subscriptions and complex agronomic advice. But the barrier to entry is much lower than the industry lets on. The fundamental principle is to apply more seed in high-potential areas of a field and less in low-potential zones. The first step is to identify those zones, and you can do that for free using public satellite imagery.
Satellites from the Copernicus Sentinel-2 mission, for example, capture imagery of your farm every few days. This data can be used to create a Normalized Difference Vegetation Index (NDVI) map, which is essentially a measure of crop health and biomass. Areas with consistently high NDVI values across several seasons are your high-potential zones, while areas with persistently low values are your problem spots. This visual data provides the foundation for your first prescription map.
Once you have this imagery, the process involves a few key steps using free, open-source GIS software like QGIS. You are not just looking at a single image, but at a historical trend. This analysis helps you move beyond reacting to in-season problems and start proactively managing the inherent variability of your fields.
- Define Your Field: In a tool like EOSDA LandViewer, you first draw the boundary of the specific field you want to analyze.
- Find Clean Imagery: Filter available Sentinel-2 images for your field by date and, most importantly, by low cloud cover to ensure the data is accurate.
- Apply an Index: Using the platform’s tools, generate an NDVI map. This will color-code your field based on vegetation density, revealing the performance patterns.
- Create Management Zones: Export this data and use a GIS program to cluster the similar NDVI values into 2-3 distinct zones (e.g., high, medium, low potential).
- Build a Prescription: Assign a specific seeding rate to each zone. This file is then loaded into your tractor’s controller to automate the variable rate application.
This “do-it-yourself” approach requires a learning curve, but it demystifies the process and puts you in complete control of your data and decisions, all without a recurring subscription fee. It’s the perfect way to test the value of variable rate on your own farm.
Retrofit Kit vs New Tractor: Which Is the Smarter Tech Upgrade?
The moment you decide to adopt precision tech, you face a major financial crossroads: do you invest in a new, factory-equipped tractor, or do you upgrade your existing, reliable machinery with a retrofit kit? For a smaller farm, the answer often lies in a “retrofit-first” mindset. The capital cost of new equipment is staggering, and the depreciation in the first few years alone can wipe out any potential savings from the technology. According to some manufacturers, retrofitting older, simpler machines with modern precision farming tools can be up to 80% less expensive than buying new equipment.
While a new machine comes with a warranty and potentially lower hourly operating costs initially, the total cost of ownership tells a different story. Older tractors have already undergone their steepest depreciation, are often mechanically simpler, and can be repaired without proprietary software or dealer intervention. As Minnesota farmer Kris Folland noted in an analysis of equipment costs, referring to older machines: “They cost a fraction of the price, and then the operating costs are much less because they’re so much easier to fix.”
The following table, based on a cost of ownership analysis from Farm Progress, starkly illustrates the financial difference over a five-year period. It highlights that while a new tractor might be slightly cheaper to run per hour, the massive initial purchase price and depreciation make the used-plus-retrofit option significantly more economical on a per-acre basis.
| Cost Factor | Used 2014 Tractor + Retrofit GPS | New 2022 Tractor (Factory GPS) |
|---|---|---|
| Initial Purchase Price | $200,000 (tractor) + $5,000-$100,000 (retrofit kit) | $355,000 |
| Operating Cost per Hour | $97.80 (higher repairs due to age) | $91.39 (lower repairs, warranty coverage) |
| Ownership Cost Advantage | $20.40 per acre LOWER than new equipment | Higher ownership costs due to depreciation |
| Depreciation Impact | Lower due to reduced purchase cost | Higher initial depreciation hit |
| Repairability | Easier DIY repairs, fewer proprietary systems | Often requires dealer service, software locks |
Choosing a retrofit kit isn’t about being anti-technology; it’s about being pro-profitability. It allows you to add the precise functionalities you need—like auto-steer or variable rate control—to a perfectly good tractor, maximizing the return on your existing assets before taking on massive new debt.
The ISOBUS Compatibility Mistake That Leaves Kit Unable to Talk
You’ve invested in a new variable rate spreader and a GPS terminal for your tractor. Both boxes say “ISOBUS Certified.” You plug them in, and… nothing. The implement won’t talk to the tractor. This frustrating and costly scenario is the single biggest pitfall in building a mixed-fleet precision ag system. The “ISOBUS” label is not a guarantee of plug-and-play functionality. It’s a standard, but one with many different layers and functions.
ISOBUS is essentially a universal language that allows tractors, terminals, and implements from different manufacturers to communicate. However, just because two people speak English doesn’t mean they both understand the technical language of engineering. Similarly, just because a tractor and an implement are ISOBUS certified doesn’t mean they support the same specific functions. The key is in the details of the certification.
The Agricultural Industry Electronics Foundation (AEF), the body that governs ISOBUS standards, is clear on this point. As they state in their guidelines, “‘ISOBUS Certified’ is not a guarantee. The crucial differences between Universal Terminal, Task Controller, and Timing & Section Control mean you must verify which functions are actually supported.” For example, your terminal might support the Universal Terminal (UT) function, which just displays the implement’s controls on the screen. But if you want to do variable rate application, you need both the terminal and the implement to support Task Controller (TC) functionalities. Failing to verify this specific compatibility before purchase is the costliest mistake a farmer can make.
Your ISOBUS Pre-Purchase Checklist
- Verify AEF Certification: Before any money changes hands, check both the specific tractor model and the implement model in the official AEF ISOBUS Database to see which functionalities they have been certified for.
- Confirm Specific Functions: Ensure both machines support the exact functions you need (e.g., TC-BAS for basic documentation, TC-SC for section control, TC-GEO for variable rate).
- Demand a Live Demonstration: Require the dealer to physically connect the implement to a tractor of the same model and prove that data is exchanged and the functions work as advertised.
- Test Section Control: If you’re buying a sprayer or spreader, verify during the demo that the automated section switching actually works based on GPS position.
- Document Firmware Versions: Mismatched firmware is a primary cause of failure. Record the exact firmware versions of the tractor, terminal, and implement you tested and ensure that is what gets delivered.
Never take a salesperson’s word for it. Due diligence through the AEF database and a live demonstration is the only way to avoid ending up with expensive, incompatible equipment.
How to Use Yield Maps to Identify Loss-Making Areas of Your Farm?
A yield monitor on your combine is one of the most powerful data collection tools available, but a yield map by itself is just a pretty picture. Its true value is unlocked when you shift your thinking from “yield mapping” to “profit mapping.” A high-yielding area isn’t necessarily your most profitable if it required massive inputs to get there. Conversely, a consistently low-yielding area might be a financial black hole where your input costs exceed the value of the grain produced. Using your yield map as a diagnostic tool is the key to turning data into profit.
The first step is to identify the stable patterns. Look at yield maps from several years. Are the same areas consistently underperforming? Ignore the anomalies caused by a one-off weather event or operator error and focus on the persistent red spots. These are your primary targets for investigation. Once you’ve identified a consistent low-yield zone, the yield map becomes your guide for targeted soil sampling and field scouting. Instead of taking random samples across the field, you take strategic samples from the heart of the poor-performing areas and compare them to samples from the high-performing zones.
This targeted approach helps you diagnose the root cause of the underperformance. Is it a nutrient deficiency, a pH imbalance, or something physical? To get to the bottom of it, you need to layer multiple data sources.
- Compaction: Take a soil penetrometer into the low-yield zones. A hardpan layer that isn’t present in the high-yield areas is a likely culprit, restricting root growth and water infiltration.
- pH and Nutrients: Targeted soil tests from your different zones can reveal dramatic variations in pH or a lack of a key micronutrient that is holding back yield.
- Drainage: Overlay your yield map with a topographic map. If your red spots are all in the lowest-lying areas, you likely have a waterlogging problem that limits production.
- Pest and Disease Pressure: Compare the problem areas with historical scouting notes. You may find that certain parts of a field are recurring hotspots for specific diseases or insect pressure.
By using the yield map to guide your investigation, you stop guessing and start making targeted management decisions. This could mean applying lime only where it’s needed, subsoiling a specific compacted zone, or even deciding to take a chronically unprofitable area out of production altogether.
How to Reduce Fixed Machinery Costs by 20% Through Cooperative Agroecology?
For a farm under 300 acres, the biggest barrier to profitability is often fixed machinery costs. A combine, a self-propelled sprayer, or a large drill might be essential for a few weeks a year, but it sits as an expensive, depreciating asset for the other 48. This is a classic problem of scale. As Pete Nelson, a VP of Agriculture Innovation, has noted, “The economies of scale necessary to be profitable in farm commodities work against the small farmer.” While AgTech can improve efficiency, one of the most powerful solutions is structural: machinery sharing through a cooperative or formal agreement with neighbors.
The concept is simple but requires a high degree of trust and organization. Instead of three neighboring farms each owning a £200,000 sprayer that is used on 250 acres, they can jointly own one £300,000 high-spec machine and share it across 750 acres. This immediately reduces the capital cost per acre for each member. The cooperative model allows smaller farms to access top-tier, efficient technology that would be impossible to justify individually. A shared, high-capacity planter can improve timeliness across all member farms, a critical factor in yield potential.
This approach transforms a fixed cost into a more manageable variable cost. Key considerations for a successful cooperative include:
- Formal Agreements: Everything must be in writing. This includes scheduling priorities (e.g., a rotating priority system each year), maintenance responsibilities, and cost-sharing for repairs, fuel, and insurance.
- Standardized Technology: To be effective, members should ideally use compatible guidance systems (e.g., all using the same brand of GPS) to make moving the machine between farms seamless.
- A Designated “Lead”: Often, one member takes the lead on maintenance and scheduling, and is compensated for their time.
- Fair Usage Calculation: Costs are typically split based on hours used or acres covered, ensuring each member pays their fair share.
Reducing machinery ownership is a direct path to improving a farm’s financial resilience. A 20% reduction in fixed costs can be the difference between profit and loss in a tight year. It’s an agroecological approach that leverages community and cooperation to solve a fundamental economic challenge, enabled by the very technology that can seem so out of reach.
How to Build a Nitrogen Plan Using Free Satellite Data in 3 Steps?
Variable Rate Nitrogen (VRN) is often seen as the domain of high-cost subscriptions, but the core data needed to start is freely available. Using imagery from the Copernicus Sentinel-2 mission, which offers a 5-day revisit frequency at 10m resolution, you can create a robust nitrogen plan with a bit of DIY effort. The goal is not just to create a single application map, but to monitor the crop’s response in near-real-time and adjust accordingly.
The process moves beyond a single snapshot. Instead of just looking at one NDVI image, the key is to analyze a time-series of images. This allows you to track the *rate of change* in biomass. A section of the field that is accumulating biomass rapidly likely has adequate nitrogen, while an area that is stagnating or greening up more slowly is signaling a deficiency. This in-season monitoring provides a much more accurate picture of the crop’s actual needs than a pre-season plan alone.
Building your own nitrogen plan can be broken down into a clear, iterative process:
- Calibrate Satellite Readings: This is a critical first step. Satellite NDVI is a relative measure. To make it absolute, you must calibrate it to your crop. Use a handheld N-sensor or send tissue samples from a few high-biomass and low-biomass areas. This creates a reliable correlation between the NDVI values and your crop’s actual nitrogen status in your specific conditions.
- Create Prescription Zones: Once you have a calibrated understanding of the NDVI, use free QGIS software to convert the imagery from your chosen application timing into 2-3 distinct management zones. You can then establish differential nitrogen rates for each zone based on their vigor and the calibration data.
- Verify with a Post-Application Audit: The feedback loop is essential. After your variable-rate application, capture another Sentinel-2 image 2-3 weeks later. The goal is to see if the canopy has “evened out,” with the previously low-vigor areas catching up to the rest. This validates your approach and proves the ROI, providing a more refined starting point for the next season.
This method requires more hands-on time than a paid service, but it puts the farmer in direct control. It builds a deep understanding of field variability and ensures that nitrogen, one of your biggest input costs, is being applied where it will generate the most return.
Key Takeaways
- The fastest ROI in AgTech comes from GPS auto-steering, which directly cuts input waste from overlaps.
- Variable rate application can be started with zero subscription cost by leveraging free Sentinel-2 satellite data and open-source software.
- A “retrofit-first” mindset, upgrading existing tractors, is almost always more profitable for smaller farms than buying new, tech-laden machinery.
Variable Rate Nitrogen: Is the £15/ha Tech Subscription Worth It?
After proving the concept of variable rate with free tools, the inevitable question arises: is it time to upgrade to a paid precision agriculture subscription? These services, typically costing around £15 per hectare, promise to automate the data processing, integrate weather data, and provide direct agronomist support. For a time-strapped farmer, this convenience is tempting, but the decision must be a cold, hard calculation of value.
The primary benefit of a paid subscription is time savings and a reduction in technical complexity. The manual process of downloading satellite images, cleaning the data, and processing it in QGIS is replaced by an automated platform that generates controller-ready prescription files with a few clicks. These platforms also often integrate advanced analytics, like weather-adjusted nitrogen modeling and change detection, that go beyond what is easily achievable with free tools. However, it’s crucial to remember that they are often built upon the exact same free Sentinel-2 data you can access yourself.
Some advanced platforms and services leverage even more powerful data. For instance, some precision spraying can achieve a massive 67.78% reduction in chemical volumes by using high-resolution multispectral drone mapping to feed prescription files. This level of precision comes at a higher cost but showcases the potential of more intensive systems. The choice between free tools and a paid subscription boils down to a trade-off between your time and your money. The table below outlines the key differences.
| Feature | Free Tools (Sentinel-2 + QGIS) | Paid Subscriptions (£15/ha typical) |
|---|---|---|
| Satellite Data Access | Free Sentinel-2 imagery, 5-day revisit, 10m resolution | Same base data plus additional high-res sources |
| Weather Integration | Manual correlation required | Automated weather-adjusted nitrogen modeling |
| Prescription File Generation | Manual processing via QGIS or ArcGIS | Automated prescription files compatible with controllers |
| Technical Support | Community forums, self-learning | Direct agronomist support and troubleshooting |
| Time Investment | High – requires data processing skills | Low – automated analysis and recommendations |
| Advanced Analytics | Basic NDVI, NDWI indices | Change detection, time series analysis, clustering |
A paid subscription is “worth it” only if the value of the time you save, plus the value of any additional yield gain or input savings from their advanced modeling, exceeds the annual cost. For a 120-hectare (approx. 300 acre) farm, a £15/ha subscription is £1,800 per year. You must be confident it will save or earn you more than that. The best strategy is to master the free tools first. This gives you a baseline ROI to compare against, ensuring you only pay for a service when you can prove it adds more value than your own informed, hands-on approach.